
What Headphone Sound Profiles Do People Like? - Harman 2018 & Preference Bounds Discussion

listener

Administrator
Staff member
Reviewer
I recently released my article on Headphones.com discussing the mechanics of Harman's 2018 research into headphone listener preference, and how certain constraints from that research have made the way this work is commonly used fraught with oversimplification and overconfidence.

Afterwards, there was some discussion that led to me resolving to make a few updates. The first, which has been pushed to GraphWorks, is that the preference boundaries can now be split between 5128 and GRAS so that people only looking at data for one headphone measurement set only have to see the boundary space for the fixture that is actually being used.
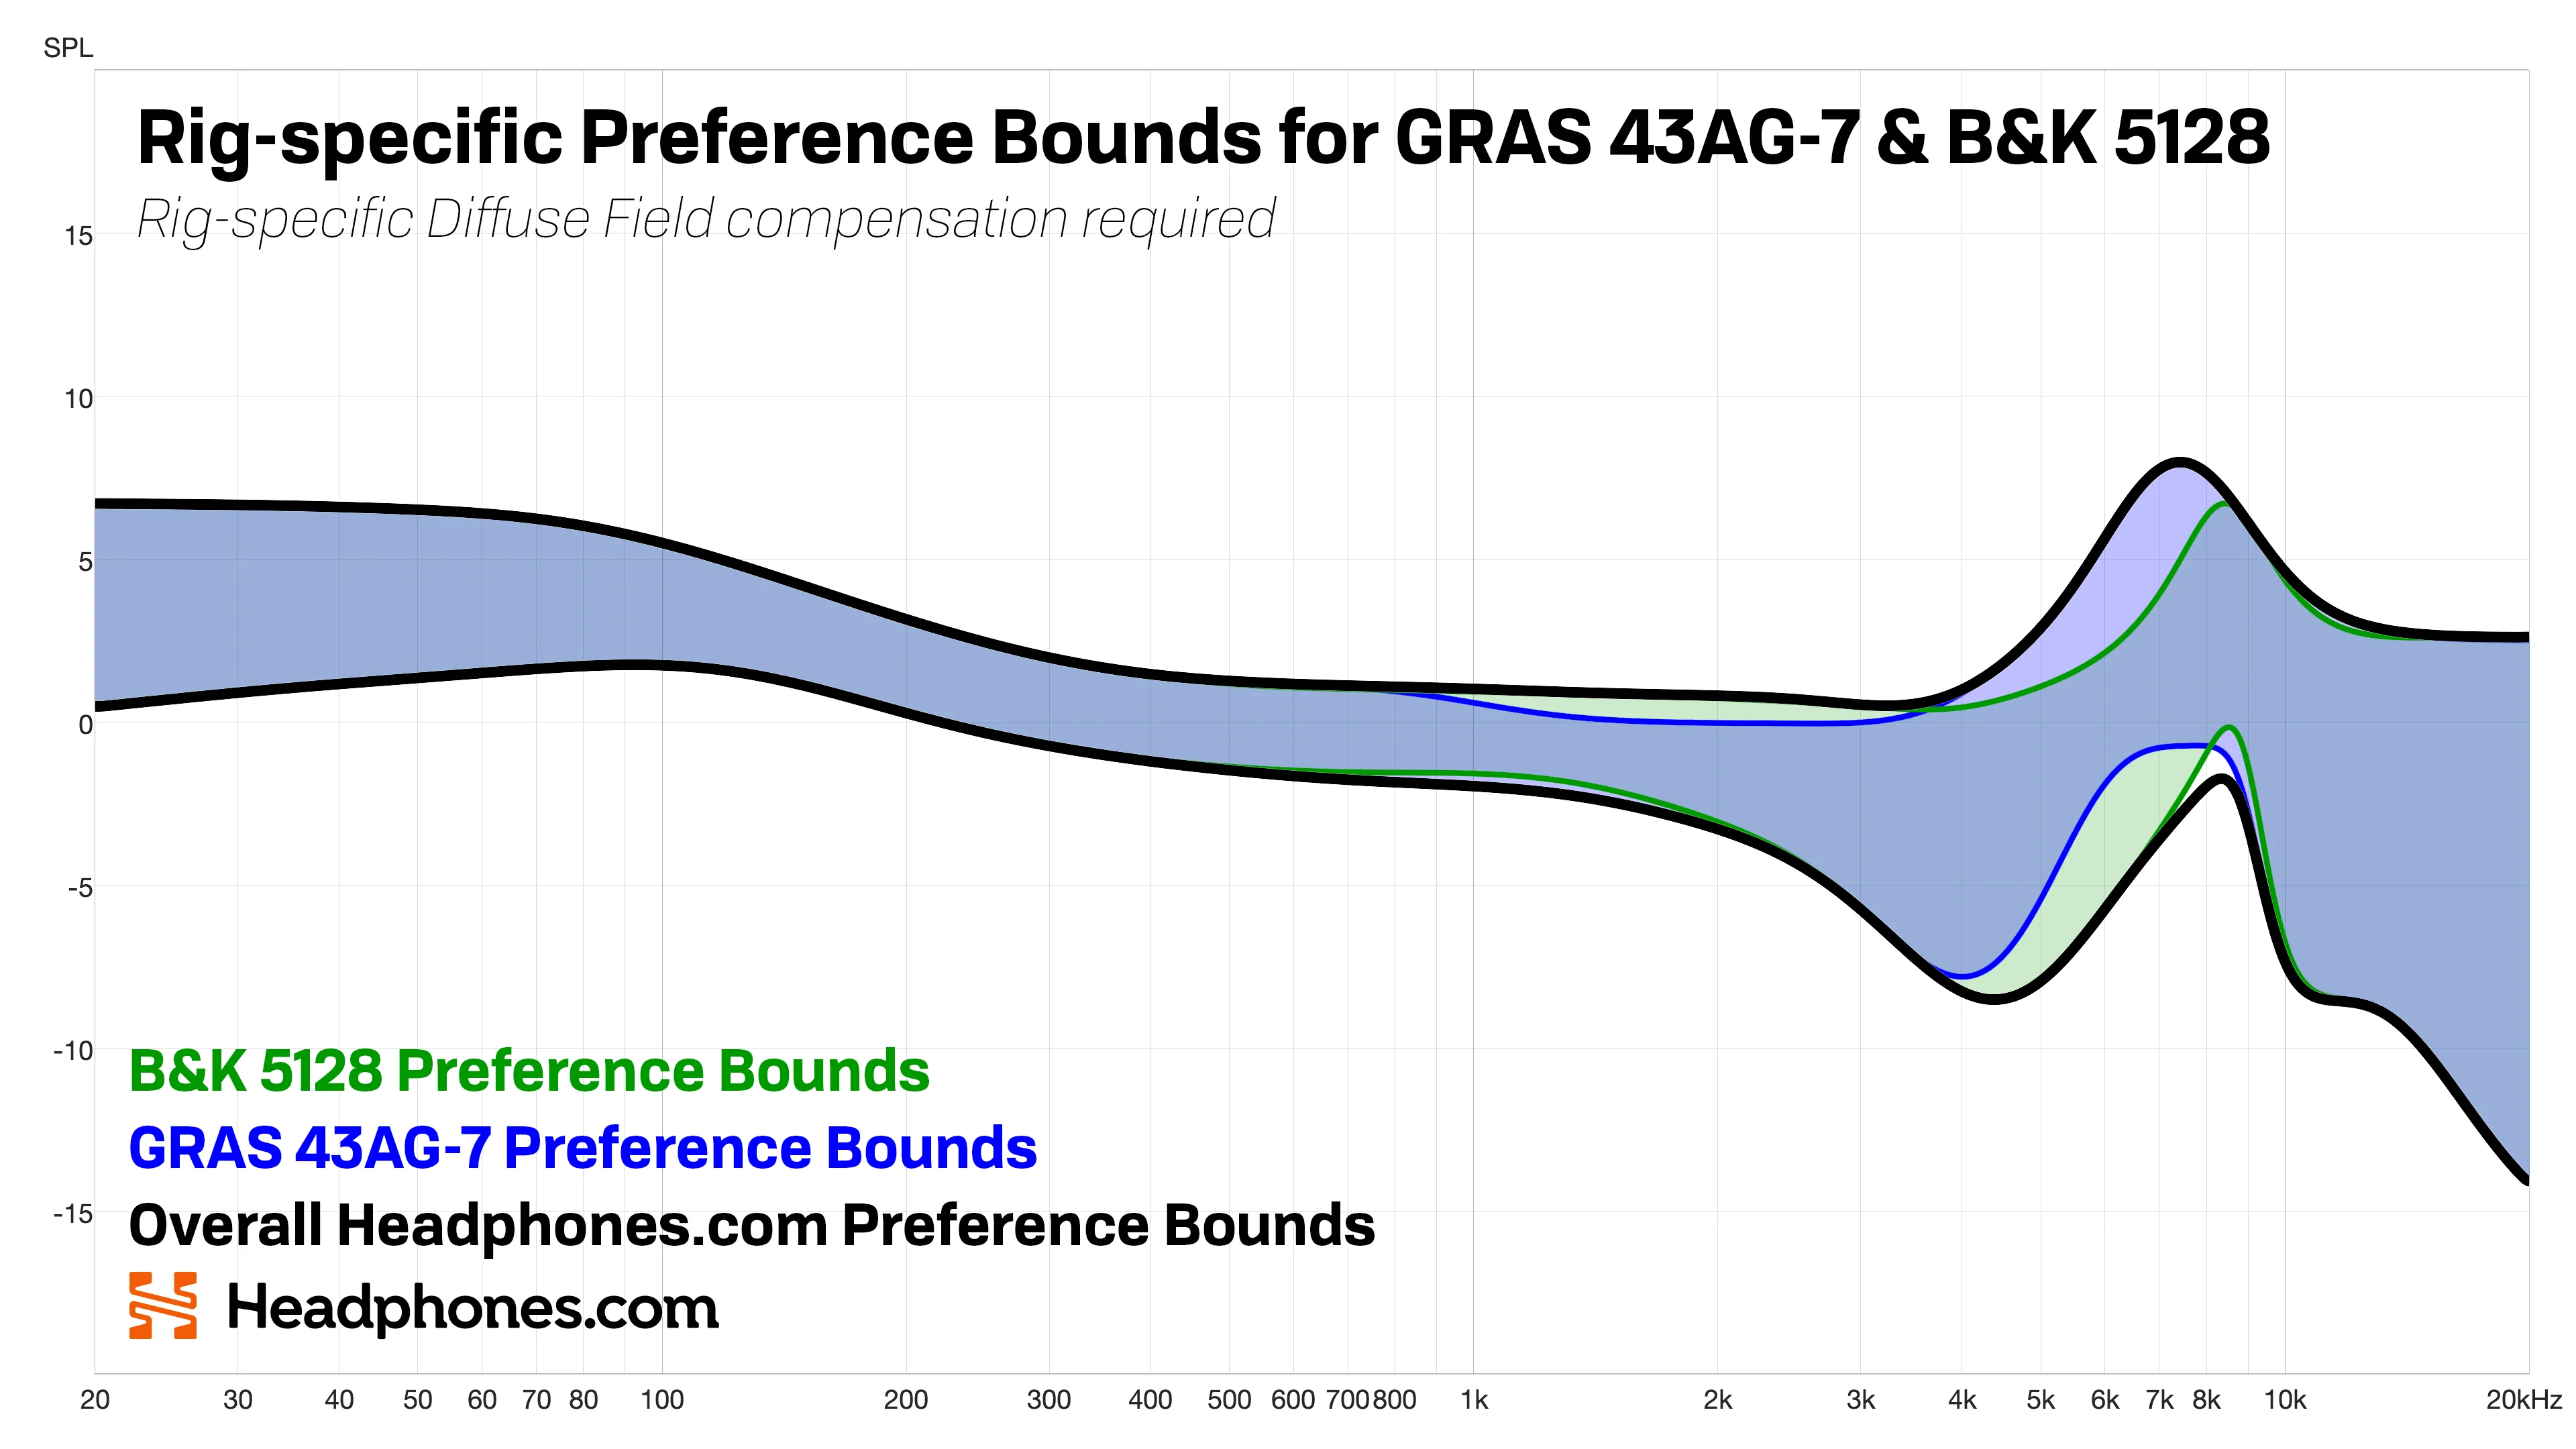
rig-specific.webp

This change has been integrated into an automatic function on GraphWorks, so users will not have to manually select boundary spaces; it should all work with no need to think about it.

The second change I'm currently working on is an additional upper-bound for the bass region in particular that automatically activates when closed-back headphones are brought into the visualizer. As we've seen from multiple sources (eg. Sean Olive, @oratory1990, and our own measurements), the magnitude of bass in closed-back headphones tends to be overemphasized on most of the fixtures we use relative to what humans receive on average, whereas open-back headphones tend not to experience this disconnect. This is important, because an open-back headphone was used as the replicator headphone in Harman's study that led to these bounds being created.

So as of now, I'm in the middle of doing some investigation as to what sort of additional range of overestimated bass is worth accommodating in our boundary space, given obviously this is going to be both headphone-specific and rig-specific behavior that will likely differ substantially across acoustic designs. Interested to hear what everyone here thinks of this premise or how to attack such a thing to make it maximally useful.

Currently, I'm working with a dataset of a few (5) closed headphones measured on a variety of fixtures, while each is compensated to the same headphone's measurement at the ear-canal entrance point of whomever actually owns the headphones, results below. It's clear that there's some level of overestimation, but the amount and shape of elevation (as expected) shifts between rigs and between headphones.
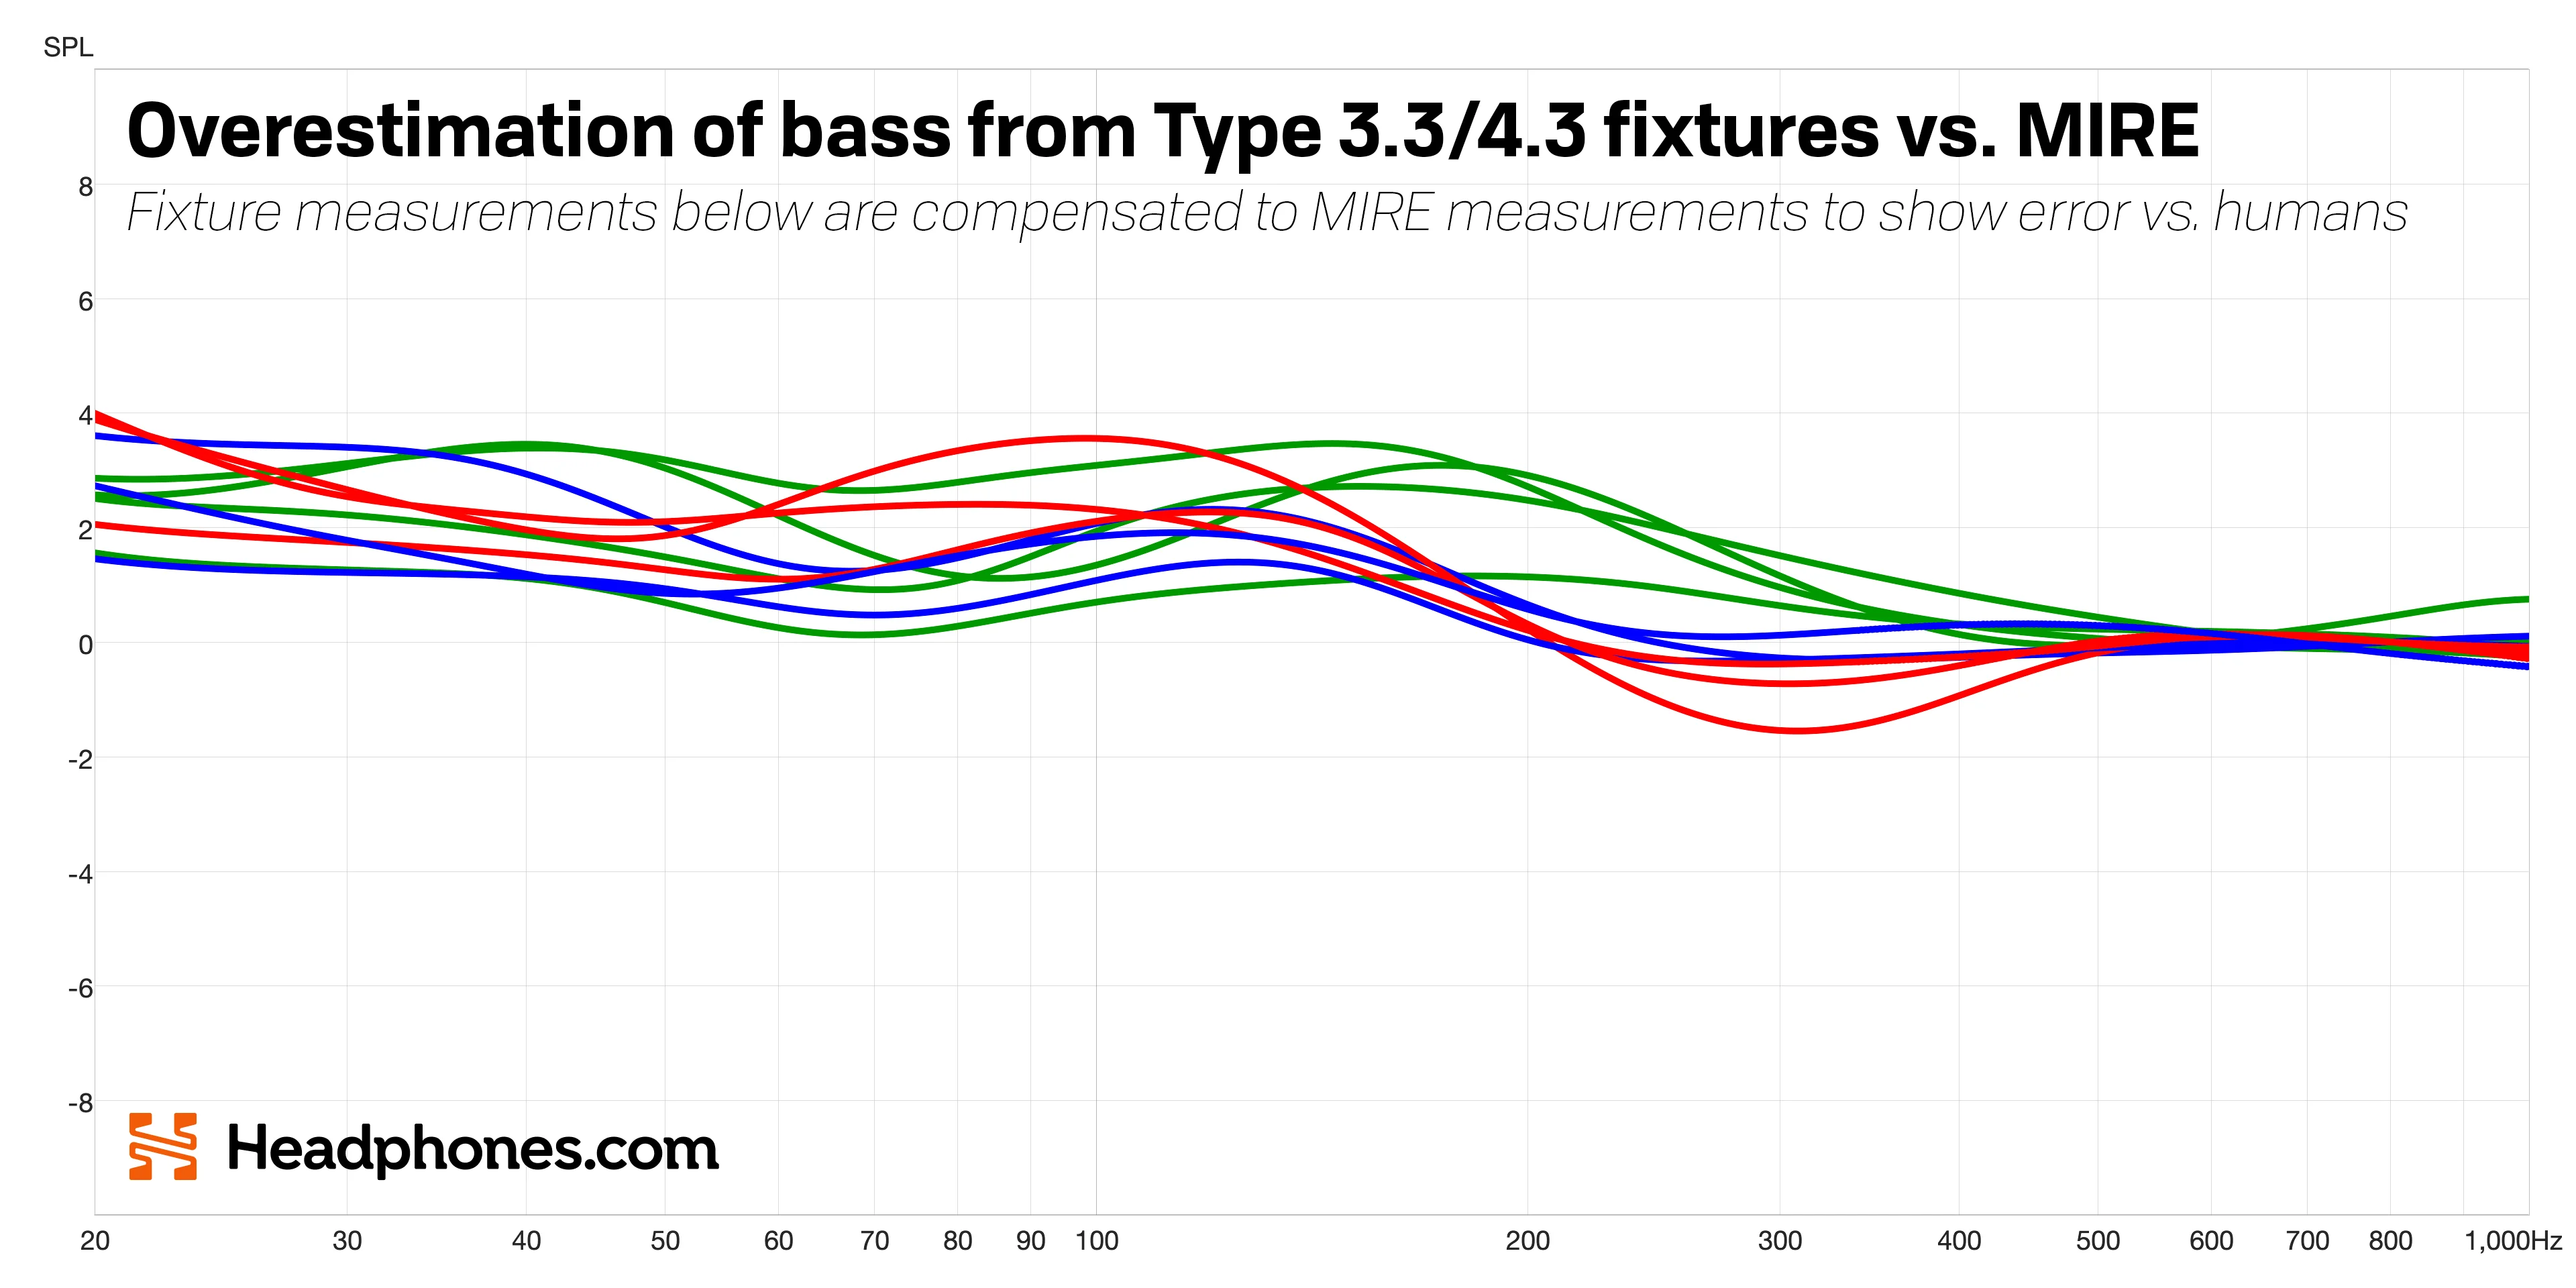
on-head labeled.webp

Interested to hear what people think is a good approach for this, or if they have any reasons why the above wouldn't be a defensible thing to give people.
 
Rig specific boundaries are an improvement, but... man... the more I think about the bounds the less I like them.

If you set aside the many data issues with the old approach, diffuse field compensation + the old bounds had a certain elegance to them. You had the objective part (the HRTF) compensated out of the plot, and the preference bounds represented the range of adjustments that tended to be selected from the MOA studies. Each aspect of the graph did one thing.

Now... it's all jumbled together. The sine illusion is back due to the features in the treble, and the bounds represent both fixture specific deviations and variation in individual preference.

The closed back problem just really exposes the challenge, because people are obviously going to want to compare the bass level of a closed back headphone to an open back headphone they might be familiar with or vice versa, but we know that the data is just fundamentally not comparable.

I don't really have a solution here. The data we have is just not split the way we might want it to be, but I'm kind of torn still on whether this even represents an improvement over the old bounds. It's more informed by the data, yes, but it's just not intuitive or elegant anymore.
 
Now... it's all jumbled together. The sine illusion is back due to the features in the treble, and the bounds represent both fixture specific deviations and variation in individual preference.
Yep, this is basically the core of my consternation when it comes to any use of this research for the things people want to use it for. These factors you mention simply are not clearly separated enough for us to be able to have a visualization as elegant as we'd like that still contains all of the data we need (as you put it, "data issues with the old approach") for it to be strictly reflective of the actual content of the study.

I will say, despite the issues with the older KB006x rig, I do still find it quite useful for headphone measurements against the older preference bounds; it doesn't seem to have nearly the same overestimation issue as the other, more anthropometric fixtures, and of course, it was actually the ear used in the 2013-2015 studies that form the basis of the older bounds.

Aside: Have people so systematically ignored the 2013-2015 works solely because the 2018 one was newer? It's always confused me, especially given the ear for the earlier studies is actually able to be purchased.

I don't really have a solution either; as far as I'm concerned all of this is just interim stuff until new studies are conducted with the express purpose of being used for evaluating headphone responses against the results. Until then, we're going to have compromise, and unfortunately I just don't think compromising on the accuracy of how it reflects the underlying data is necessarily better than elegance, considering most of the people looking at headphone measurement data are already pretty game to adopt new visualizations—hence changing their approach meaningfully roughly 3 times in the last 6 years or so.
 
Last edited:
While I do value the extra information provided by the new bounds, I'm also the type to try and understand what's being presented and grasp the argument.
However, from experience in public or not-so-public discussions, we (I assume, all participants here have encountered it more than enough times) know that this approach isn't shared by a lot of the people actually trying to use the presented data, which commonly results in confusion, spreading misinformation, and poor personal decisions.
So there is also something to be said for making new visualizations easier to grasp even on an intuitive level, something, which, arguably, has been happenning in previous iterations. As one of the solutions that comes to mind, could the new bounds be compensated away on per-rig basis, to present as bands around a new flat line, similar to how the previous bounds were compensated to a target? I'm fairly certain I'm not the first person to come up with this, so I'd be curious to learn why this isn't the approach that's been chosen.

That said, the cat is out of the bag for this iteration (especially since it's interim, though I do wonder how long it'll last us), and with states of various graphing tools differing one-to-another so much in how up-to-date they are, it's probably best to keep particular iterations of means of data representation at least somewhat consistent and not create extra confusion (i.e. with naming collisions, and avoiding "new new new meta bounds 3 _final", etc.)
 
As one of the solutions that comes to mind, could the new bounds be compensated away on per-rig basis, to present as bands around a new flat line, similar to how the previous bounds were compensated to a target? I'm fairly certain I'm not the first person to come up with this, so I'd be curious to learn why this isn't the approach that's been chosen.
The main sources of hesitance there are twofold (honestly there may also be more I'm forgetting, we talked about this numerous times behind the scenes):

- Targets tend to fall in/out of vogue rather often, and simple Diffuse Field compensation is a bit more robust to the onward marching of time in that respect. If a New Best Target™ comes out in the future, it will be very easy to apply that target to our current (but in the future, older) visualizations just by applying the same DFTF compensation to that target (or by removing that DFTF compensation from the currently DF compensated data to then re-process it to become cromulent with New Best Target™).

- The research does not offer a target response that is guaranteed to be more preferable to the other well-preferred responses and the most preferred target response does not uniformly occupy the center of the bounds. So IMO we don't have sufficient justification to choose one response as the compensation baseline over others, but even if we did, compensating to a zero line when the zero line falls so close to the boundary edges in multiple places in the FR just looked terrible... and even worse in terms of sine illusion because the medium-Q treble features of any of the preferred responses would be baked-in (in the inverse) to the compensation and make the boundary lines way more jagged than they currently are.
 
Last edited:
As the person at proximate fault for boundaries being in concept, I continue to struggle a bit with the question of how we achieve two contradictory goals simultaneously:

First, highlighting the variation which can exist in headphones which are equally preferred, which is a very significant point, because it is approximately the "noise floor" of our inference of sound quality from headphone measurements. Second, still making it clear when headphones have variation beyond the threshold of equal preference. This is the most common reasonable complaint about the boundaries: saying "headphones with response magnitudes at the extremes of this area were equally or near to equally preferred" is not the same thing as saying "any response which falls within this area will be equally preferred", and it's easy to infer the latter from the visualization.

Honestly, I think that there is something still to be learned from Sean's old approach with PPR and showing the regression line - it seems likely from what we know that the "tolerance mask" in one section of the frequency response is a function of the response in other areas of the frequency response, so having something "adaptive" in that sense would have merit. The problem there is that to actually do that, you need a predictive model which actually makes those inferences, and that's the real sticking point. We have PPR, which has terms for slope in addition to average error, but in order to define an "equal preference window" as a function of slope or similar, you'd need a fully new model and to test it on actual data.

And, of course, variation in what is equally preferred for a given fixture FR is only one dimension of variation - obviously targets cannot themselves represent things like HpTF variation or vulnerability to leakage, but equally obviously without well-controlled listening tests those variables contaminate the apparent preference spread data. In the absence of a meaningfully-sized listening test, you will almost without question end up with a quite broadly sized "target" no matter what you do, simply because of the known sources of variation which exist.

If I were in the disadvantageous position of having to present data publicly at the moment, I legitimately probably would go back to the dataset from Olive et al 2018 and test out whether I could make a predictive model to see if something more restrictive can be made, which rejects less-preferred responses from the Harman dataset which would currently slide into the boundaries while not rejecting the equally-preferred responses. What I'm talking about here isn't a full-on re-engineering of PPR (although such a thing could be done), but rather a model which simply assesses whether a given response would statistically tie Harman, refined until it excluded 100% of the tested FRs which didn't and did not exclude any of those which did.
 
And, of course, variation in what is equally preferred for a given fixture FR is only one dimension of variation - obviously targets cannot themselves represent things like HpTF variation or vulnerability to leakage, but equally obviously without well-controlled listening tests those variables contaminate the apparent preference spread data.

This is further complicated by the way that Harman did the EQ in their listening tests. The conventional wisdom of not applying high-Q corrections in the treble was not really followed, and so even the target likely didn't sound as good as it could have. I imagine if you had thrown Harman, but as EQed by Oratory1990, and not the way it was done in the study, into the mix, it could have scored a good few points higher.

I do genuinely think that the Harman Target is the best target in the study and that with a few changes to the listening test it would have outperformed everything, but this is a guess and not directly supported by the data.
 
I have a Question. Are you guys able to EQ some headphones (closed and open back, maybe in ear and on ear) with Tone Gen, Show how close on average it is to your people's personal DF HRTF and maybe compared to the new prerefense bounds? Maybe it shows people how it can be for them and that it may be a good baseline to find out or add personal preference to the EQ. I personally found out that people who, almost without exception EQ a headphone with tone gen likes the sound alot and add a bass shelf in the end (because it sounded pretty "flat and boring" or "neutral" to them. the tests i did is just a little thing i did with strangers that tried the method and given me feedback. i sadly have no actual gear or knowledge to write something important and crazy about it. But i think (or it is unnecessary) it can help people visualise the results because humans learn and understand faster by doing and seeing.
 
Back
Top